
Compiled 25 November 2018, updated 27 June 2025
The use of the badge (see above) was adopted by imitating what was in use at Dominick’s in Chicago
Foreword:
the analysis below was carried out on company balance sheets.
To better understand what Ros (return on sales = operating profit divided by net revenue x 100, read here.
The results:
one of the many stories that have circulated about me is that I would bring Esselunga poor financial results for 2003 and that this would lead to my removal.
Nothing could be more untrue.
If you look at the numbers, you can see that the 2003 Ros (*), compared to that of the early 1990s, was decidedly better, thanks in part to careful management of contracts with suppliers (see the example of Barilla) and to the negotiations carried out in the ESD Centre. On the contributions collected from suppliers, I recommend you read this article onCuore oil with clear references to my book, “Le Ossa dei Caprotti”.
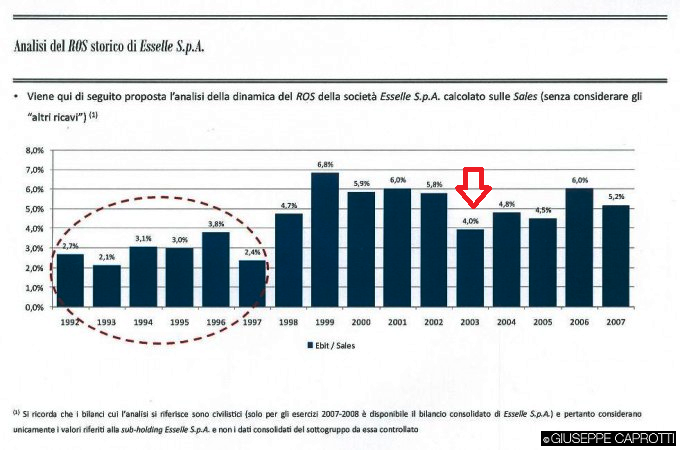
(*) not counting the results of the late 1990s and early 2000s, since I had started as commercial director in 1996.
And already a year later one could see a big difference.
For Ros you can read a comparison between the results of 2003 and those of 2013, but what we can anticipate is that in 2003 there was a budget and that this budget was respected.
On the elements of the 2003 Ros that I could not control I recommend‘All about my father‘
And a subsequent analysis of Esselunga’s balance sheets from 2003 to 2017 confirms what has already been said:
that the negative economic results, for 2003, was a ‘fairy tale’, especially with regard toEBITDA orgross operating margin, which is a way of assessing a company’s performance by excluding financial decisions or the fiscal environment from the calculation.
EBITDA stands for “earnings before interest, tax, depreciation and amortisation” and is the right index to judge my work: I had no control over depreciation, derivatives, finance, etc.

In summary :
- significantly higher profitability than in the 1990s: the operating result from the 1990s to the early 2000s is multiplied by 2.5.
The change is evident in the following chart on gross margin.

2.sales per square metre: they were already the second highest in Europe in 2002, after Britain’s JSainsbury’s.
3. market share growth: according to IRI, Esselunga grew by 7.09% in packaged goods while the reference market grew by only 4.77%;
4.growth in Fidaty customers ( 7 .8%),
5. revenue growth ( 7.2%)
6.normal retailprices: Esselunga was third out of hundreds of retailers in Italy in terms of retail prices, according to data from Altroconsumo.
Below: the subject of one of the two Armando Testa quality campaigns, wanted by Giuseppe and Violetta Caprotti.
